


Don’t Let Your People Burn Out! How to Easily Spot Over and Under Allocations
Getting a perfect balance when it comes to resource planning is not exactly easy-peasy. First you need to check what resources are available, when and for how long. Then try to fit them into your project schedule. And after these steps are done, check your project overall allocations against project planning! In case planning doesn’t fit, spotting over and under allocations is the fastest way to restore the balance. So, where can you make a quick allocation check?
In the Resource Planner
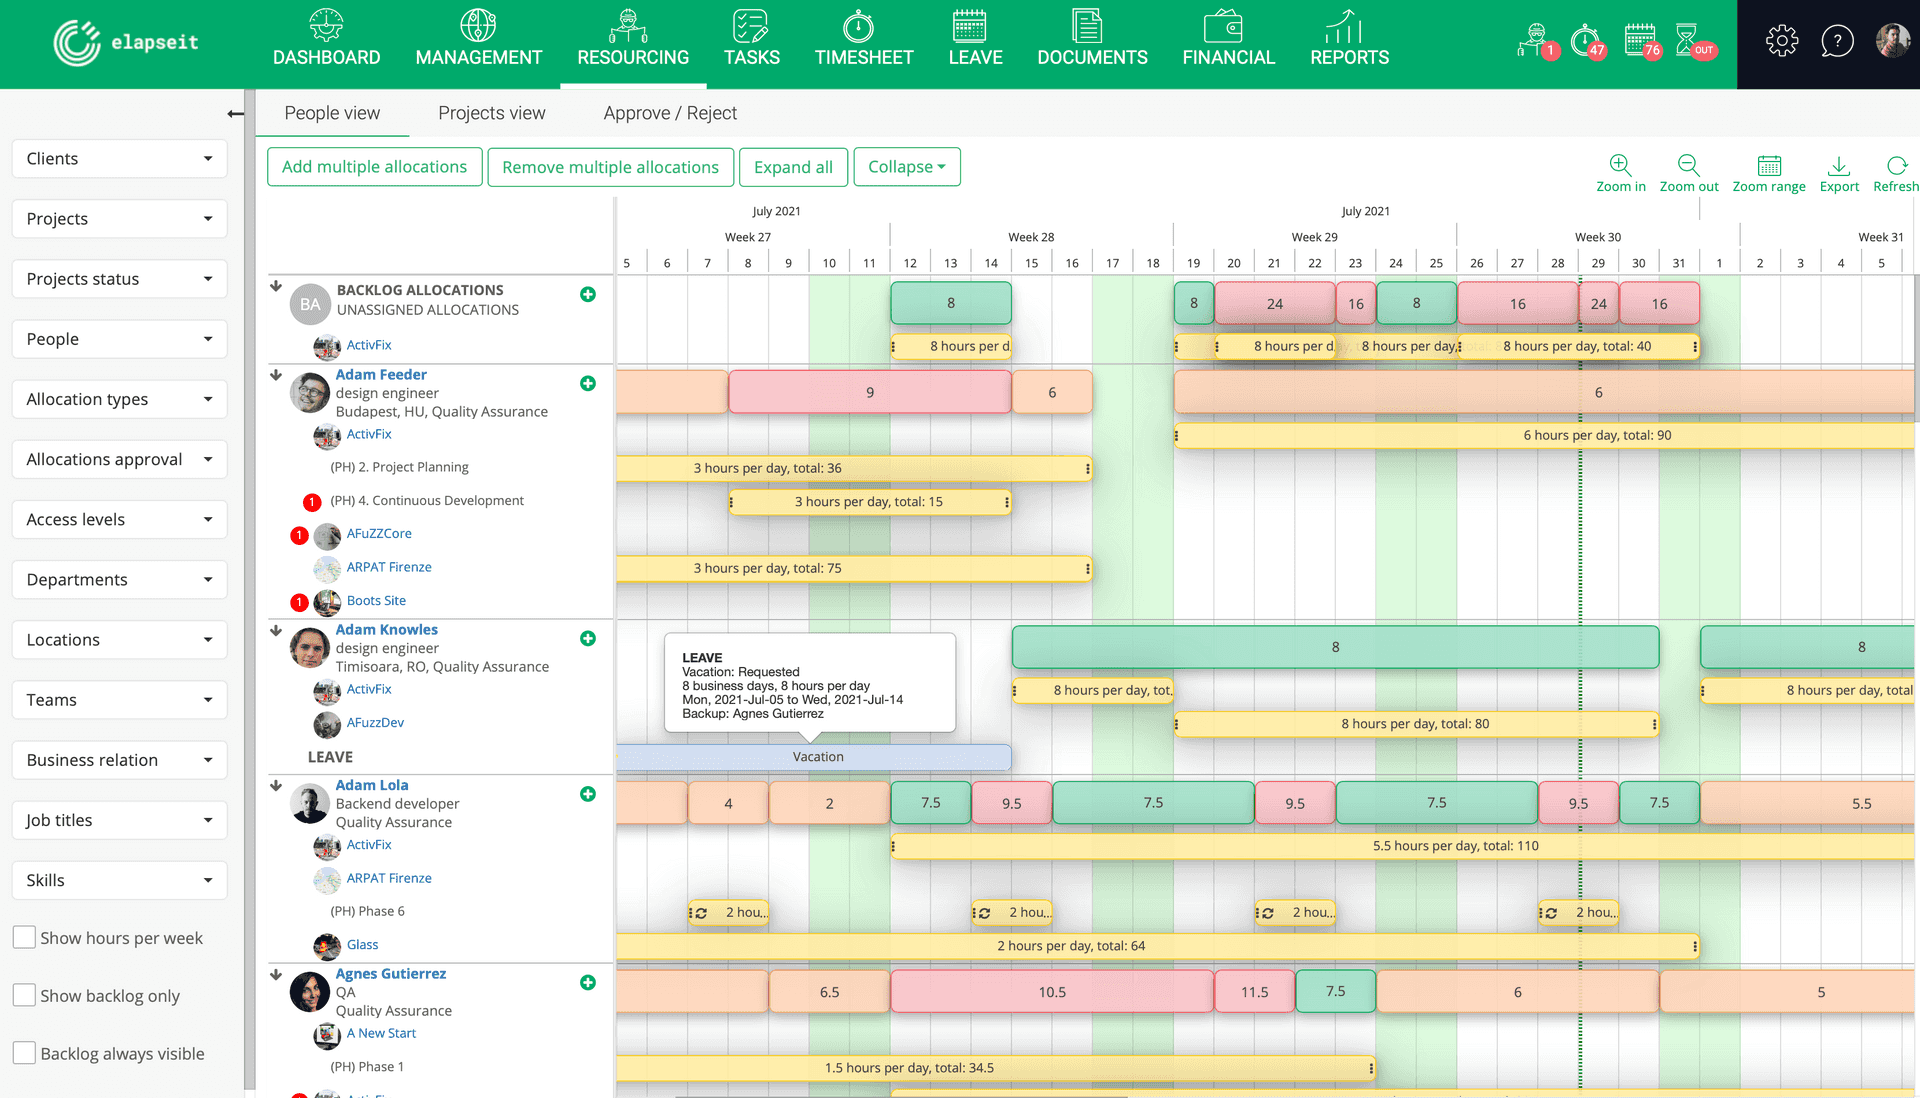
Both People and Projects views are very easy to “read” due to the colors that indicate the status of each allocations. Let’s say you’re in People view. Do you see any red bar? If you do, that’s not a good sign! People in your project team with red allocation bars have more hours than they could work. You should check if those extra hours can be directed to those with orange allocation bars because they’re under allocated. When the planner is green, it’s all good! You achieved the “zen” state in resource planning.
Click on one of your team members allocation bar and a tooltip will pop up to offer you more details (number of business days with allocation, allocation start and end date, number of current tasks and their status).
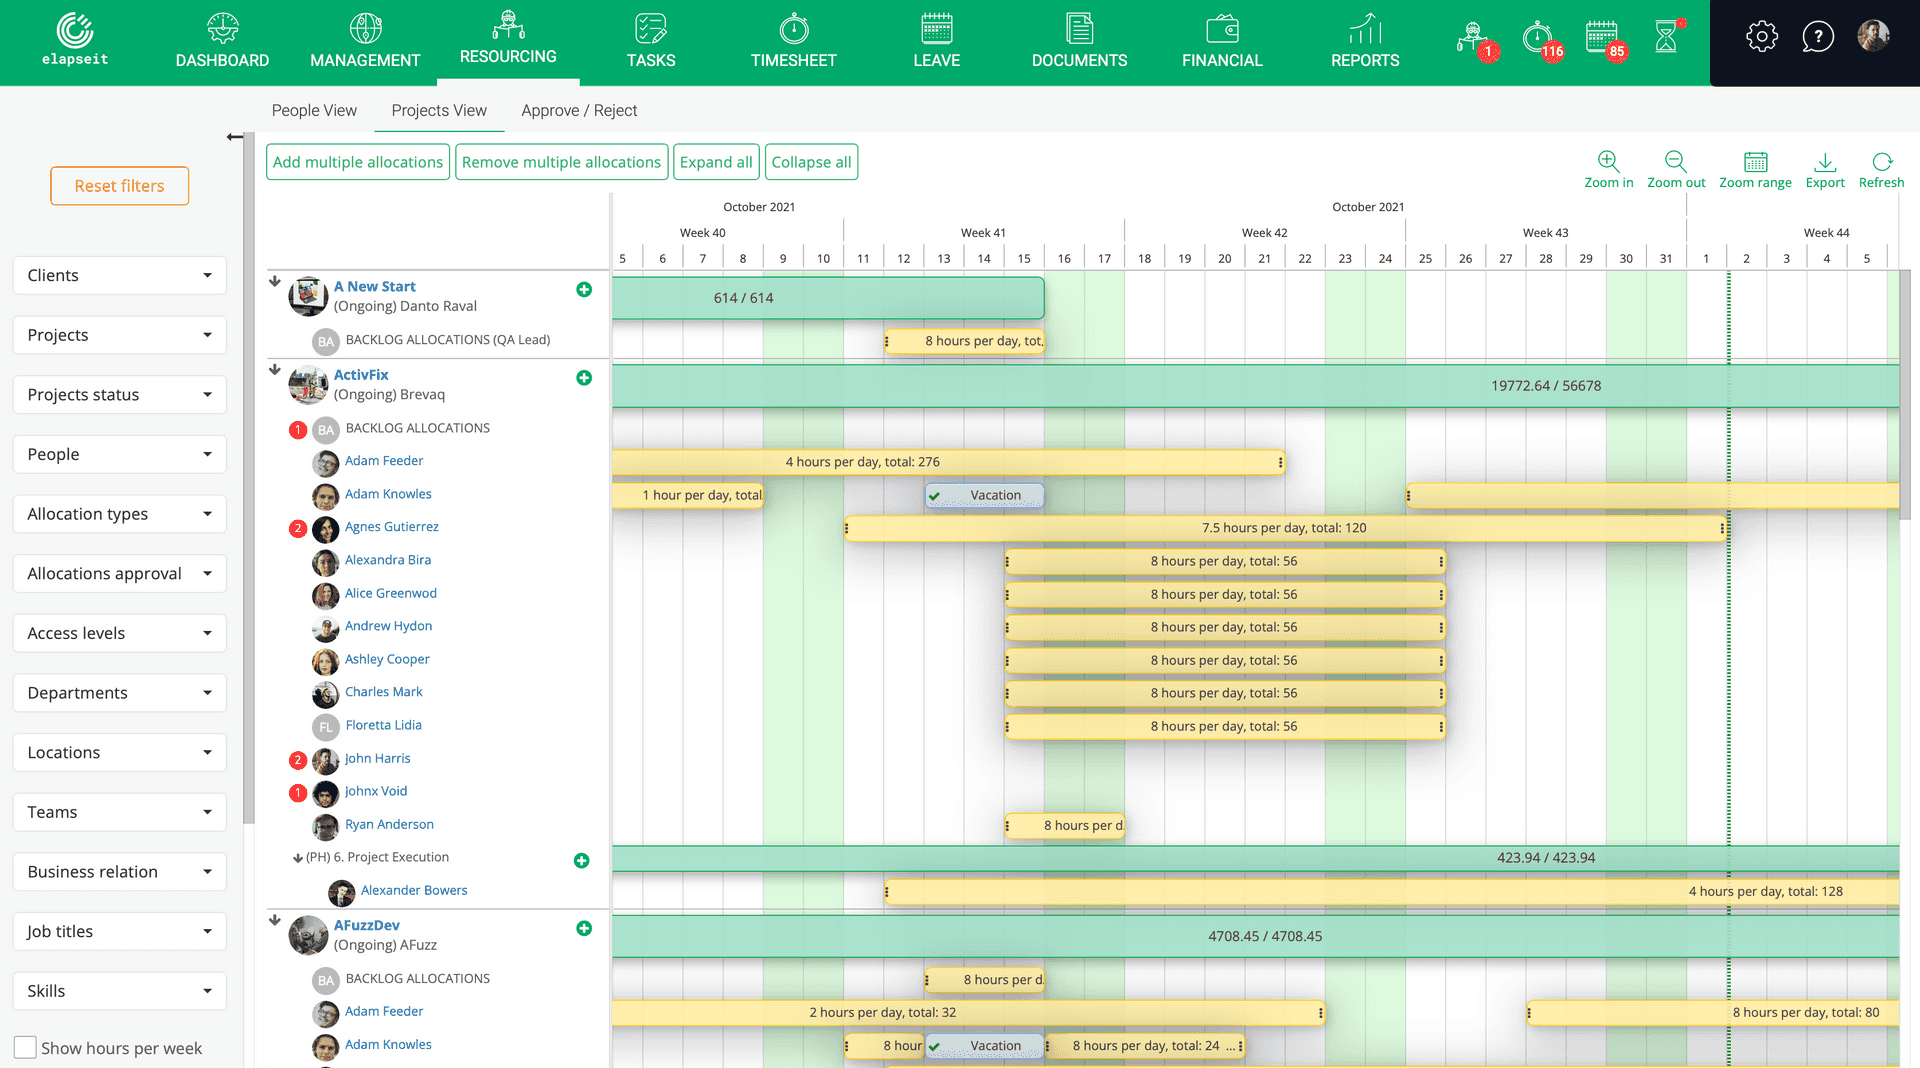
And, if you want another perspective, go to People view to check over and under allocations. It works the same way: red means the number of allocated hours is higher than the budgeted hours while green means there’s either full allocation or less allocated hours than budgeted. Here you’ll not only see the resources allocation, but also an allocation status on each project. So, keep an eye on the allocation bar corresponding to each project. If it’s green, all good there. If it’s red, you need to allocate more people on the project.
In Project Stats
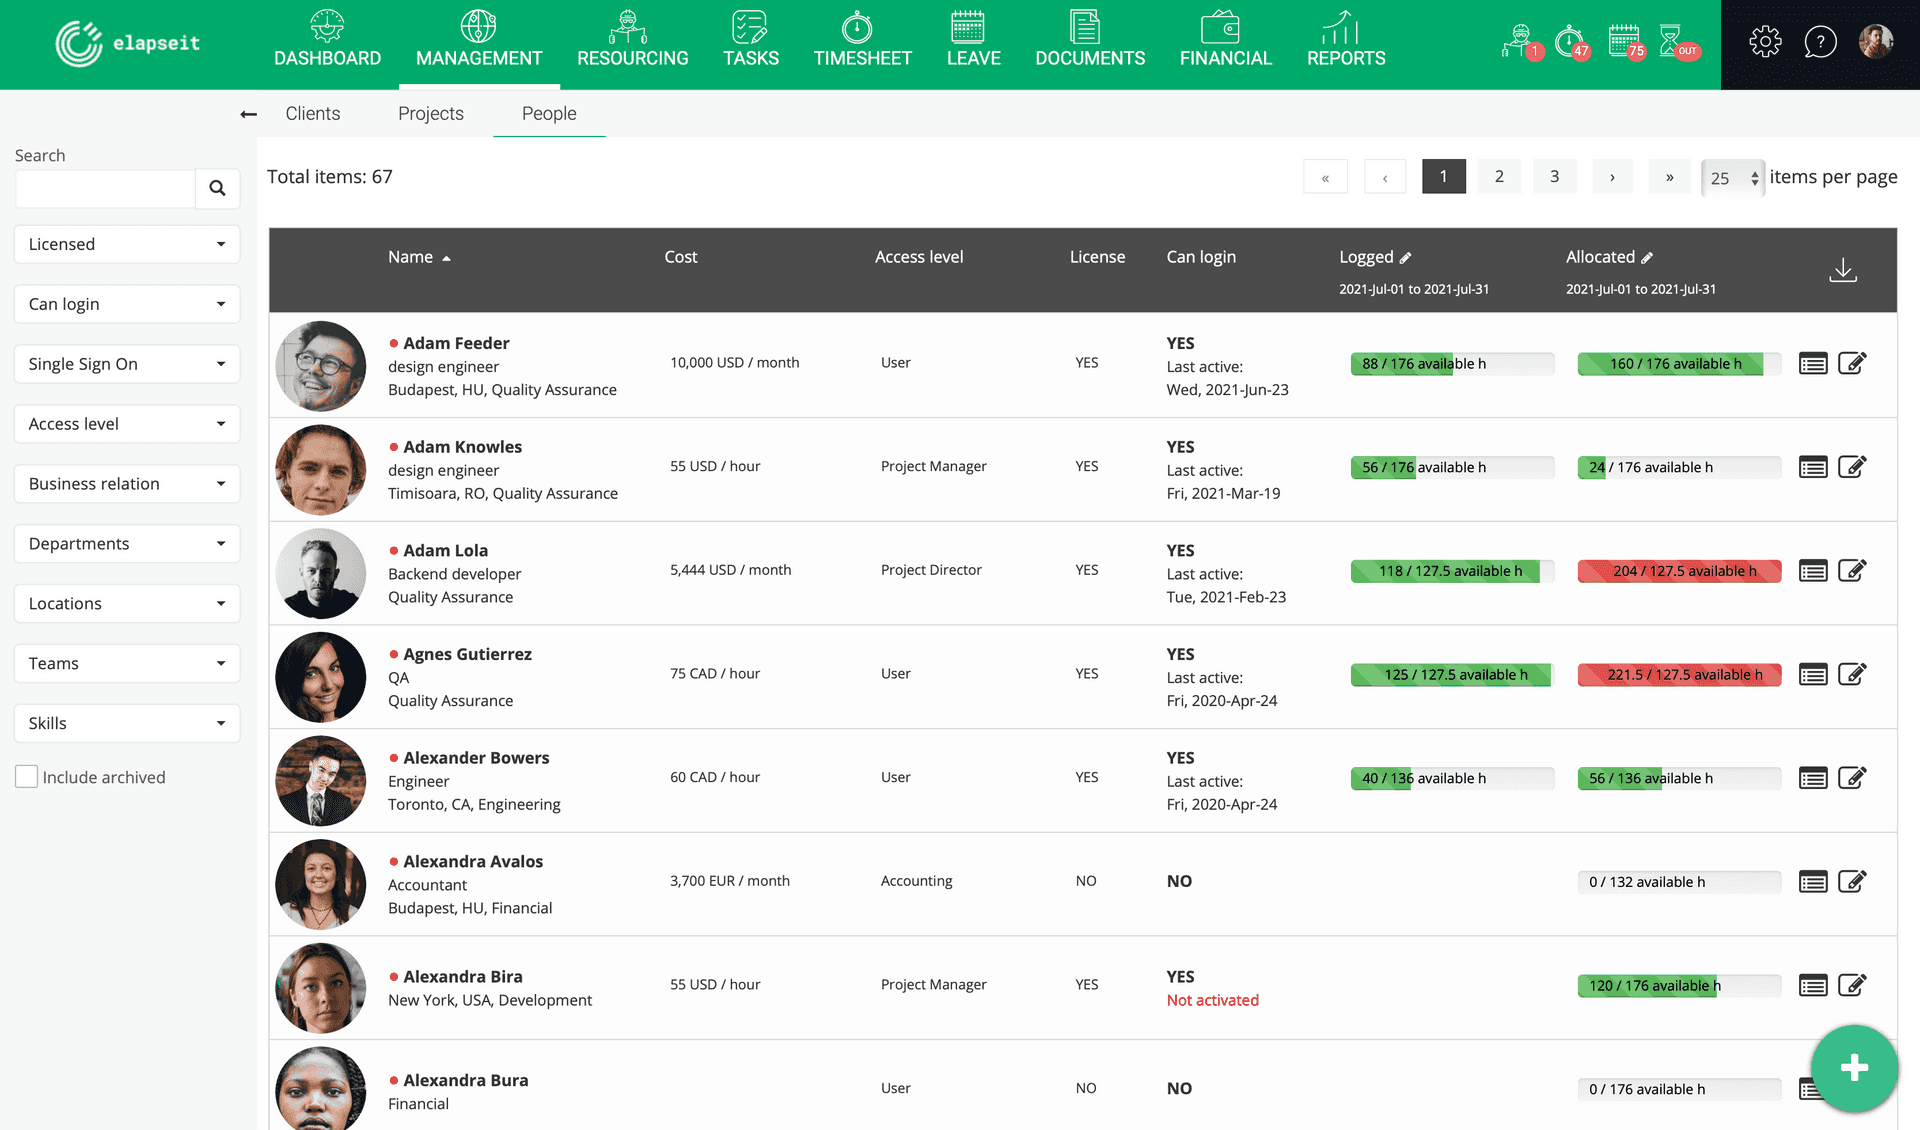
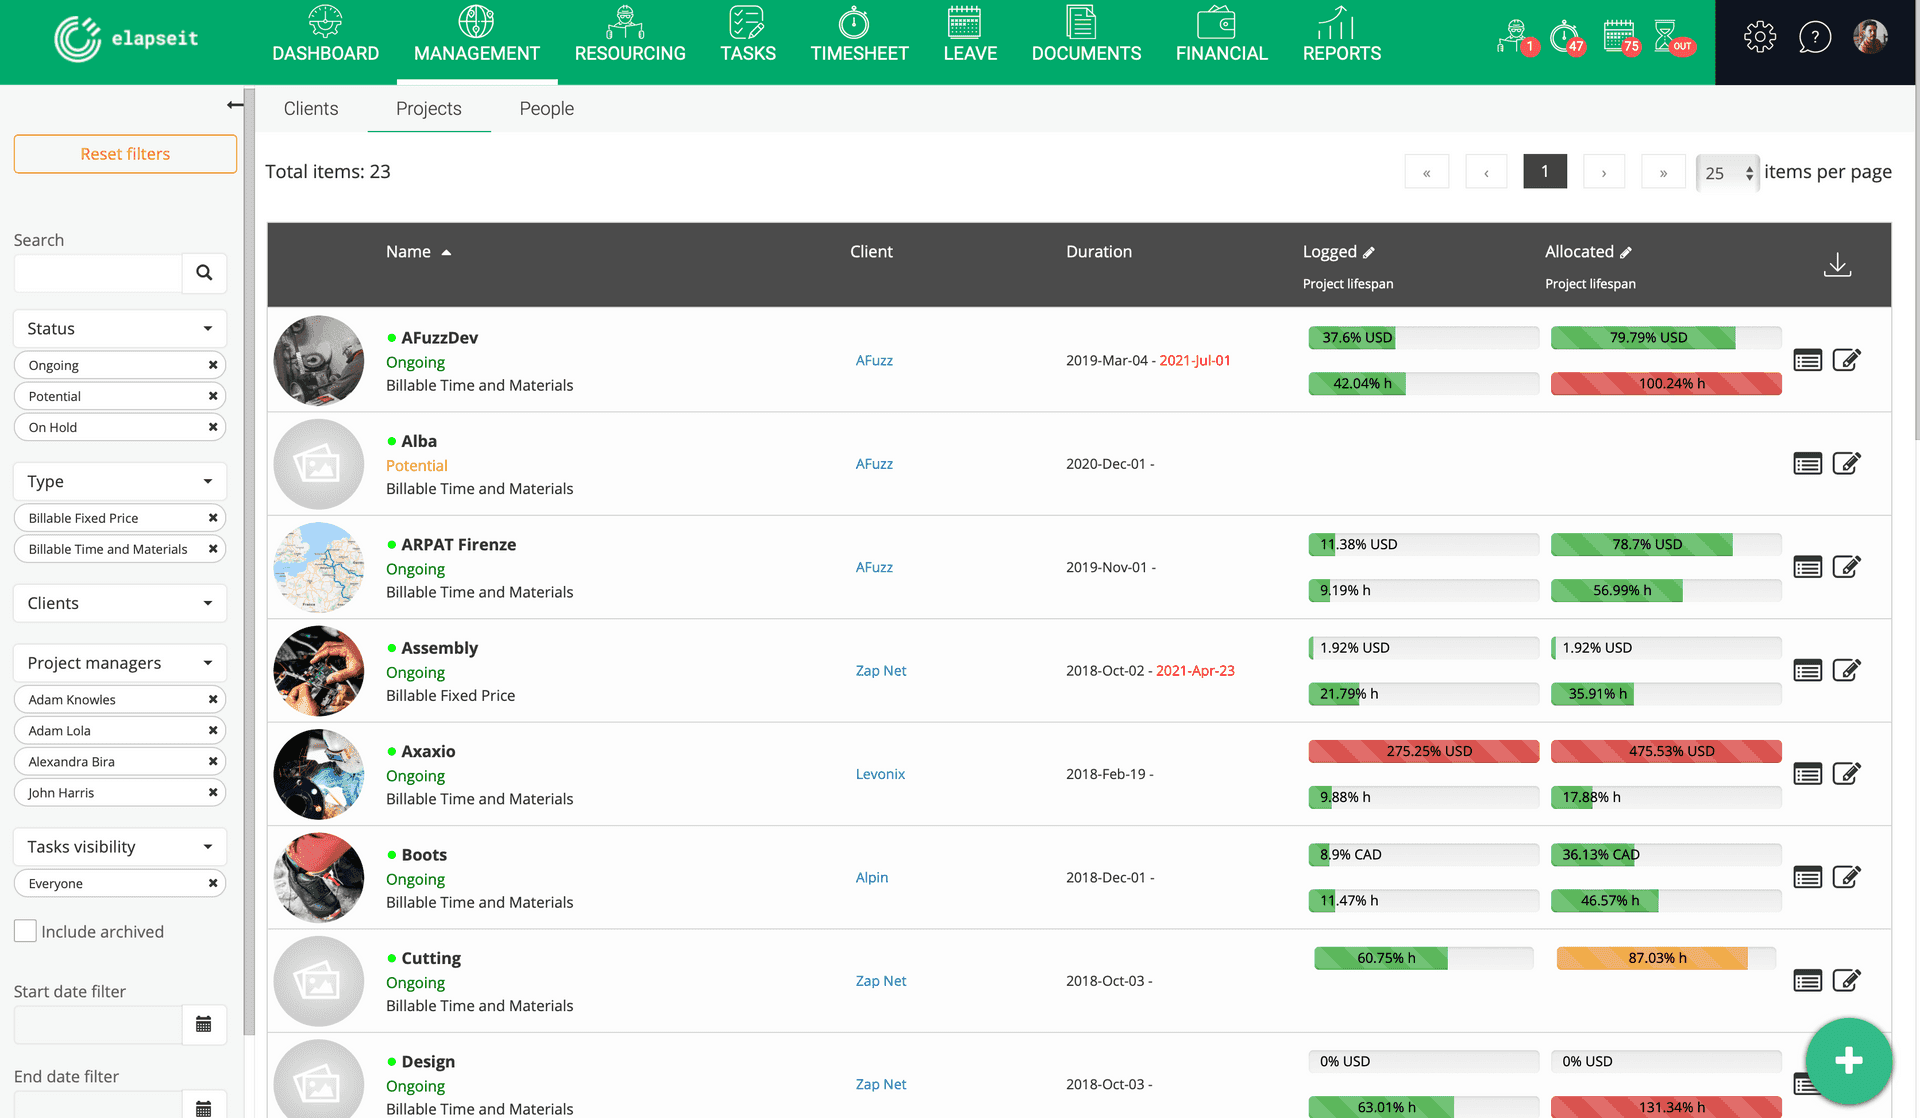
You can also easily spot over and under allocations in Management module, either People view or Projects view. Here you can see how many hours were allocated on your project vs budgeted hours or people’s allocated hours vs total available hours for the current month. While in Projects view, make sure you check “show hours only” box in Stats options window.
Again, colors are the key to understanding your stats: green means you’re within project’s hours budget (in Projects view) or people aren’t burnt out (in People view); orange lets you know you’re on the edge. But when you see red, you’re already on fire and you need to act fast.
Bear in mind you decide when the warning should hit you. You can set the limits in Settings / Customize / Project burn/allocation warning (%).
On Your Dashboard
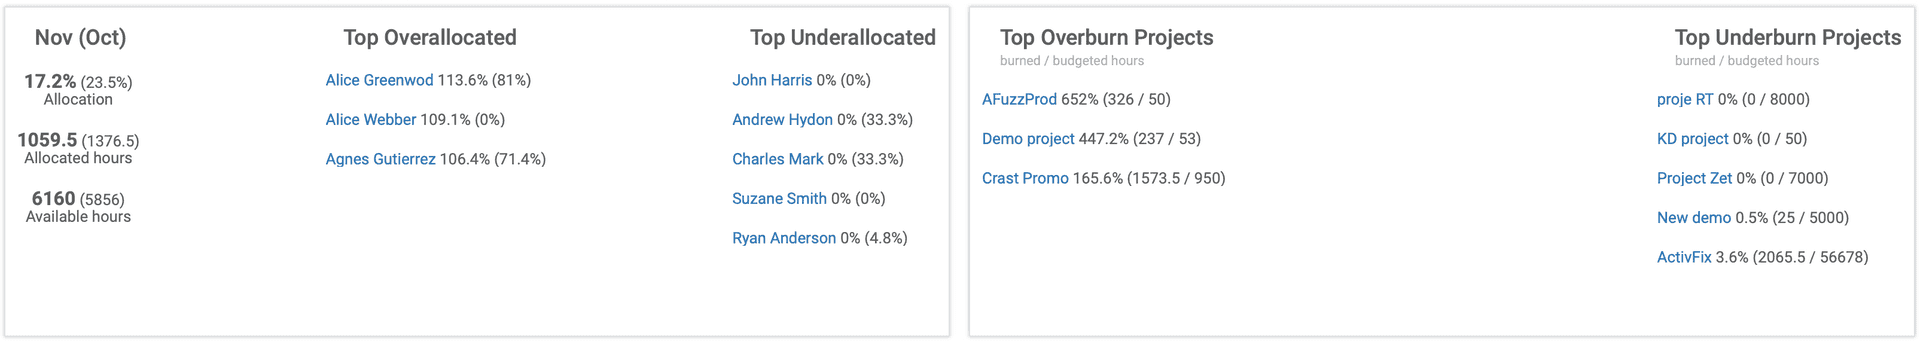
And last, but not least, the dashboard is another view where you can get an insight about the most over and under allocated resources.
In People view, you’ll see a list with top 5 over and under allocated people. At the same time, in Project view, you’ll see the most over and under burn projects (in both percentage and number of hours). Keep in mind the data reflects current and previous month allocations.
Plenty of ways to check where balance is disturbed, right?